Gold and Silver Surge: is the Correction Over?
23 July 2026
Gold and silver prices have surged over the past three trading days, with silver pushing back up toward USD $60 per troy ounce (oz), while gold has pushed back above the USD $4,100oz price level.
The move is not a surprise, with gold rallying from key technical support levels, with opportunistic buyers adding to their metal positions in recent days. Long-term accumulators continue to buy physical bullion in the USD $3,900oz to USD $4,150oz price range.
What has been pleasing about the price action in the past three days is the broader environment in which it has occurred. Expectations for a potential Fed interest rate hike in September have strengthened, while yields across the curve have risen. The U.S. dollar (as proxied by the DXY, or Dollar Index) has also rallied, last trading above 101, while the conflict in the Middle East shows no meaningful sign of easing.
Expectations of tighter policy, higher bond yields and a higher USD would typically be a trifecta of bearish news for gold—or at least headwinds to any price rally—but it has not played out that way in recent trading days.
At a minimum, this suggests there is the potential—though not the guarantee—that gold could continue to rally from here, with silver likely to follow suit.
"Gold could continue to rally from here,
with silver likely to follow suit"
Trading activity that we are seeing at ABC Bullion demonstrates a notable uptick in demand this week, for gold as well as silver. Many clients understandably want to see some positive price momentum, and a clear bounce off the all-important USD $4,000oz price point for gold, before adding to their positions.
If conditions mimic what we have seen in recent history, those adding to their positions at current price levels are likely to be well-rewarded, with our early July update highlighting that a near 40% rally in gold (and a 100% rally in silver) could be seen by January 2028, should the market reclaim prior highs.
It has also been pleasing to see clients utilising our latest silver promotion to add the metal to their portfolios, with 5oz ABC Silver Eureka Minted Bars offered with reduced premiums.
Price charts provide further context when it comes to the likely outlook for precious metals, with the chart below showing the USD gold price over the last 12 months. The red and green candles are the gold price itself, while the thinner pink, yellow and green lines represent the 55-day, 100-day and 200-day moving averages respectively.
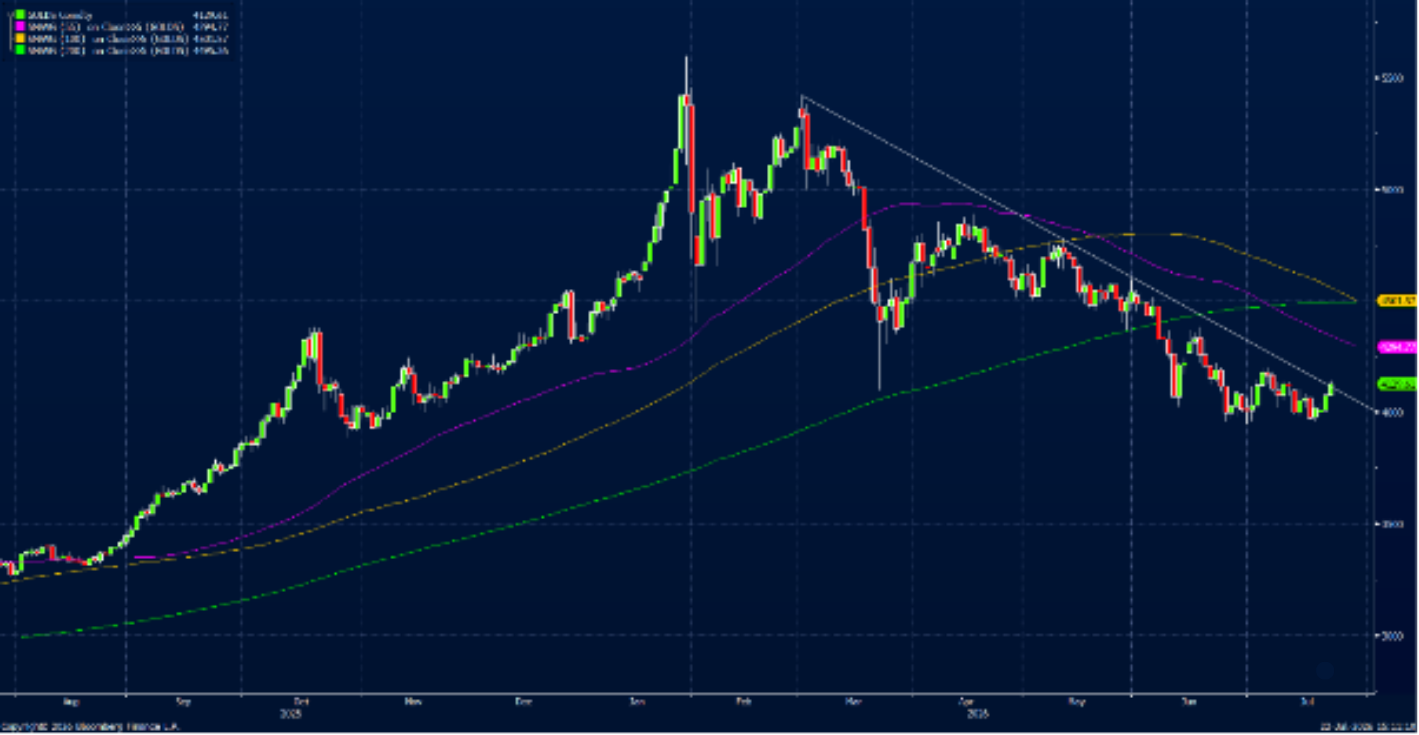
The chart reinforces how important the USD $4,000oz price point level is for gold, with the sharp retracement we saw from the January high likely to see strong buying support at that level.
The chart also shows that the 55-day and 100-day moving averages are still trending downward, and the that the 200-day moving average is now near USD $4,500oz. This places spot gold close to 10% below this moving average.
That is in line with similar pullbacks that we have seen in the now 25-year secular bull market, with the average duration of those pullbacks suggesting the current cycle will fully play out by late August 2026, less than a month from now.
Market positioning does suggest another retest of the lows seen in late June and early July is possible—with ETF outflows and the unwind of gross long positioning in the futures market not as significant in the current pullback as it was in prior cycles.
As an example, gold’s 20% fall in 2022 saw North American ETFs shed 7% of their holdings, whereas in this cycle that number has been closer to 5%. Gross long-positioning has also fallen only 6% in this cycle, versus falls of closer to 50% in prior gold pullbacks—though it must be said that the absolute gross long positioning in the market today no longer shows any signs of exuberance.
Should gold go on to retest—or even again temporarily fall below—USD $4,000oz, we expect to again see a wave of physical demand, with long-term precious metal bulls likely to see anything below that price point as a last opportunity to accumulate at bargain levels.
Until next time.

Jordan Eliseo
General Manager, ABC Bullion

Luke Tyler
Senior Analyst, ABC Bullion
Disclaimer: This document has been prepared by Australian Bullion Company (NSW) Pty Limited (ABN 82 002 858 602) (ABC). The information contained in this document or internet related link (collectively, Document) is of a general nature and is provided for information purposes only.. Although the information and opinions contained in this document are based on sources we believe to be reliable, to the extent permitted by law, ABC and its associated entities do not warrant, represent or guarantee, expressly or impliedly, that the information contained in this document is accurate, complete, reliable or current and accept no liability for any loss or damage relating to any use or reliance on the information in this document. The information is subject to change without notice and we are under no obligation to update it.