Gold: The Perfect Correction and the Road Ahead
13 August 2026
Gold and silver delivered one of their strongest weekly performances since the January sell off began, with both metals closing about previous key resistance levels.
Gold rose from USD $4,240 per troy ounce (oz) to an intra-week high near USD $4,4450oz, currently trading at USD $4,412oz (+4.05%), with the precious metal now up by more than 10% from the mid-July low. Silver outperformed, currently trading at USD $65.50oz, up from USD $61.50oz the prior week (+6.5%).
In local terms, gold is currently trading at AUD $6,252oz (+4.0%), while silver is sitting just above AUD $93oz (+6.5%) respectively, with the AUDUSD exchange rate relatively stable over the period (~0.7051).
The gold-to-silver ratio continues to trade range bound (67-71), marginally above its historical average (60:1) dating back to 1970, suggesting silver may outperform further in the period ahead.
Markets were focused on the Wednesday’s US inflation data, which showed consumer prices rising by 3.4% annually (a slight decrease from the 3.5% seen in the 12 months to June) and the possibility that the Fed could maintain a hawkish bias into September, with traders pricing in a 47% probability of a rate rise (CME Group).
A softer USD (USD strength index or DXY falling below 100) and reduced rate hike expectations have supported the gains in precious metal throughout recent days.
From a technical perspective, gold looks bullish. USD gold is now comfortably trading above its 10 and 50-day moving average (DMA) and only 5% below its 200-DMA, noting it was 13% below to 200-DMA in mid-July.
This signals a clear trend reversal, breaking out from a multi-week base that had built near USD $4,000oz, a price level we have spoken about in many market updates in recent times.
Recent price action has been accompanied by increasing volume and bullish momentum indicators. New resistance levels hover around the 200-DMA (~$4,500oz), with new support at the 50-DMA ($4,150oz) along with the lower phycological support at USD $4,000oz.
Encouragingly, the mid-July low of USD $3,972oz increasingly appears to represent a major cyclical bottom following the sharp correction off January's record highs. While it remains impossible to call a market low with certainty, the successful defence of the USD $4,000oz support level multiple times over the last two months bodes well.
Along with an improving technical outlook and renewed bullish momentum following prospects of a deal to reopen the Strait of Hormuz, it is now likely that the worst of the correction is behind us.
The road back to USD $5000oz
To provide some perspective on what may lie ahead, the table below examines the average performance of USD gold following previous major troughs since 2003.
This analysis builds on previous research undertaken by ABC Bullion in early June, which examined the historical behaviour of gold following major cyclical tops, and the technical corrections that followed.
What we have seen transpire in the weeks since mimics those historical periods, with the bounce in gold that we have seen in early August following what was in many ways the perfect market correction.
Across the eight historical troughs analysed, gold has generated an average return of 9.1% over the subsequent three months, 14.9% over six months and 21.4% over the twelve months following the price bottoming out.
Assuming a similar scenario plays out after the 17 July 2026 low of USD $3,972oz, implies potential price targets of USD $4,333oz, USD $4,564oz, and USD $4,822oz over the next three, six and twelve months respectively.
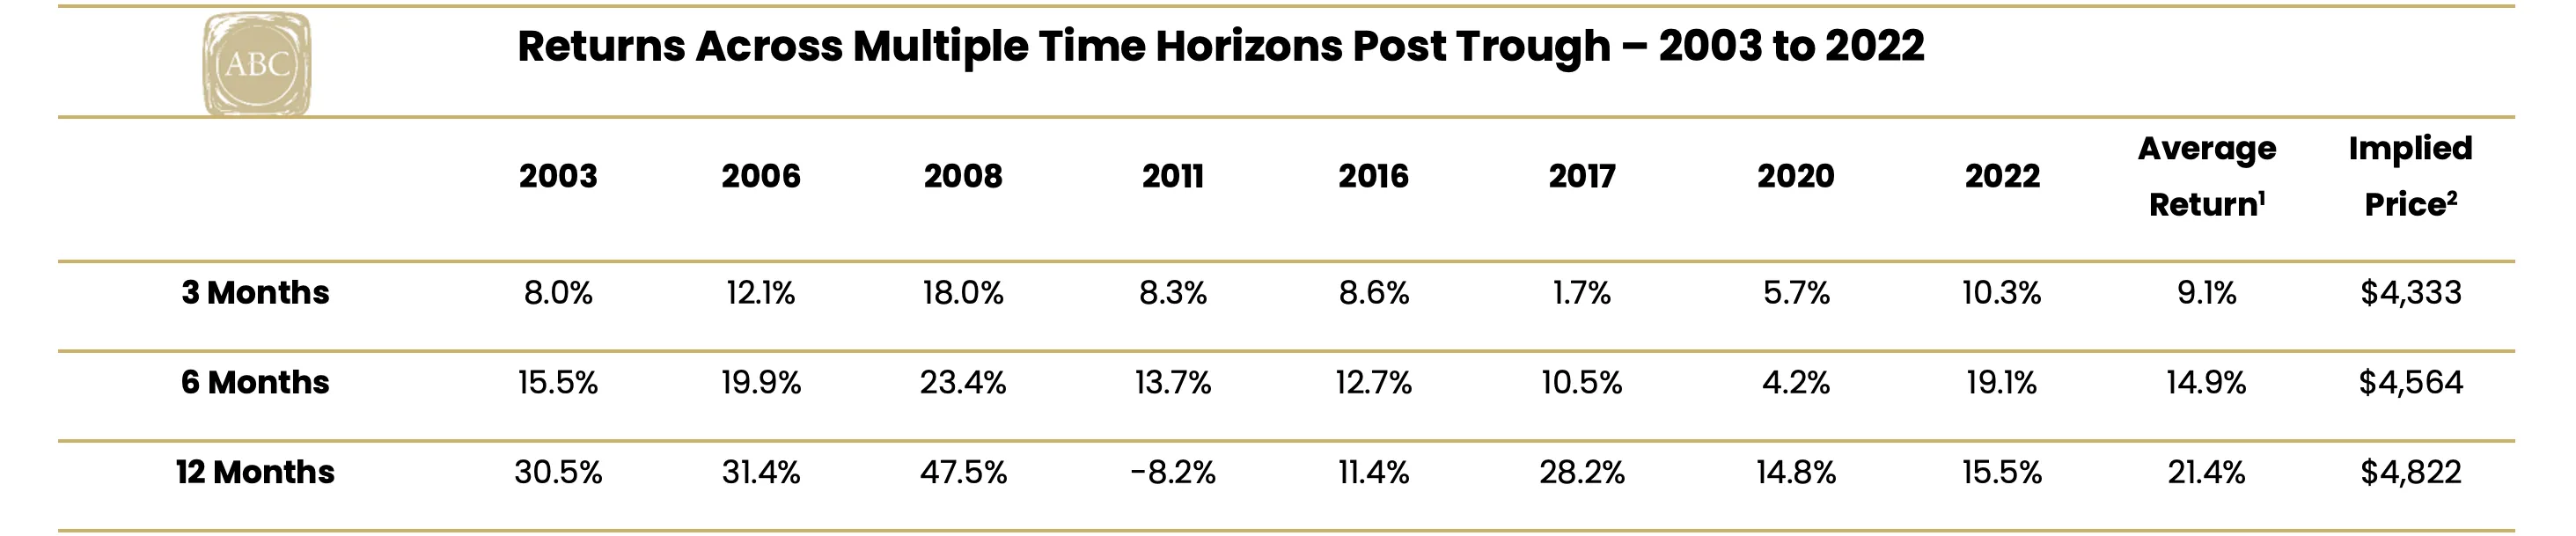
Source: LBMA, ABC Bullion. Notes: 1. Returns shown represent the average 3-, 6-, and 12-month returns following previous major gold price troughs. 2. Forecasts assume the current gold price trough occurred on 17 June 2026 at USD $3,972oz, with projected 3-, 6-, and 12-month returns based on the average performance observed after prior troughs.
While history is never a guarantee of future performance, the analysis above highlights that major gold price troughs have typically been followed by periods of above-average returns as investor sentiment recovers and underlying bull market fundamentals reassert themselves.
Notably, the forecasted 12-month target of USD $4,822oz implies a ~9% upside to current price levels, placing gold ~16% off its previous January 2026 all-time high.
This reinforces the view that the long-term bull market remains intact despite the volatility and correction experienced over the majority of the last 6 months.
For evidence of these assumptions and forecasts, consider the chart below, which shows the USD spot price (gold line) of gold, with the metal rising from below USD $300oz to over USD $4,300oz over this period. The black line shows how far above or below the gold spot price was trading on any given day relative to the average of the previous 200 days (200-DMA) in percentage terms.
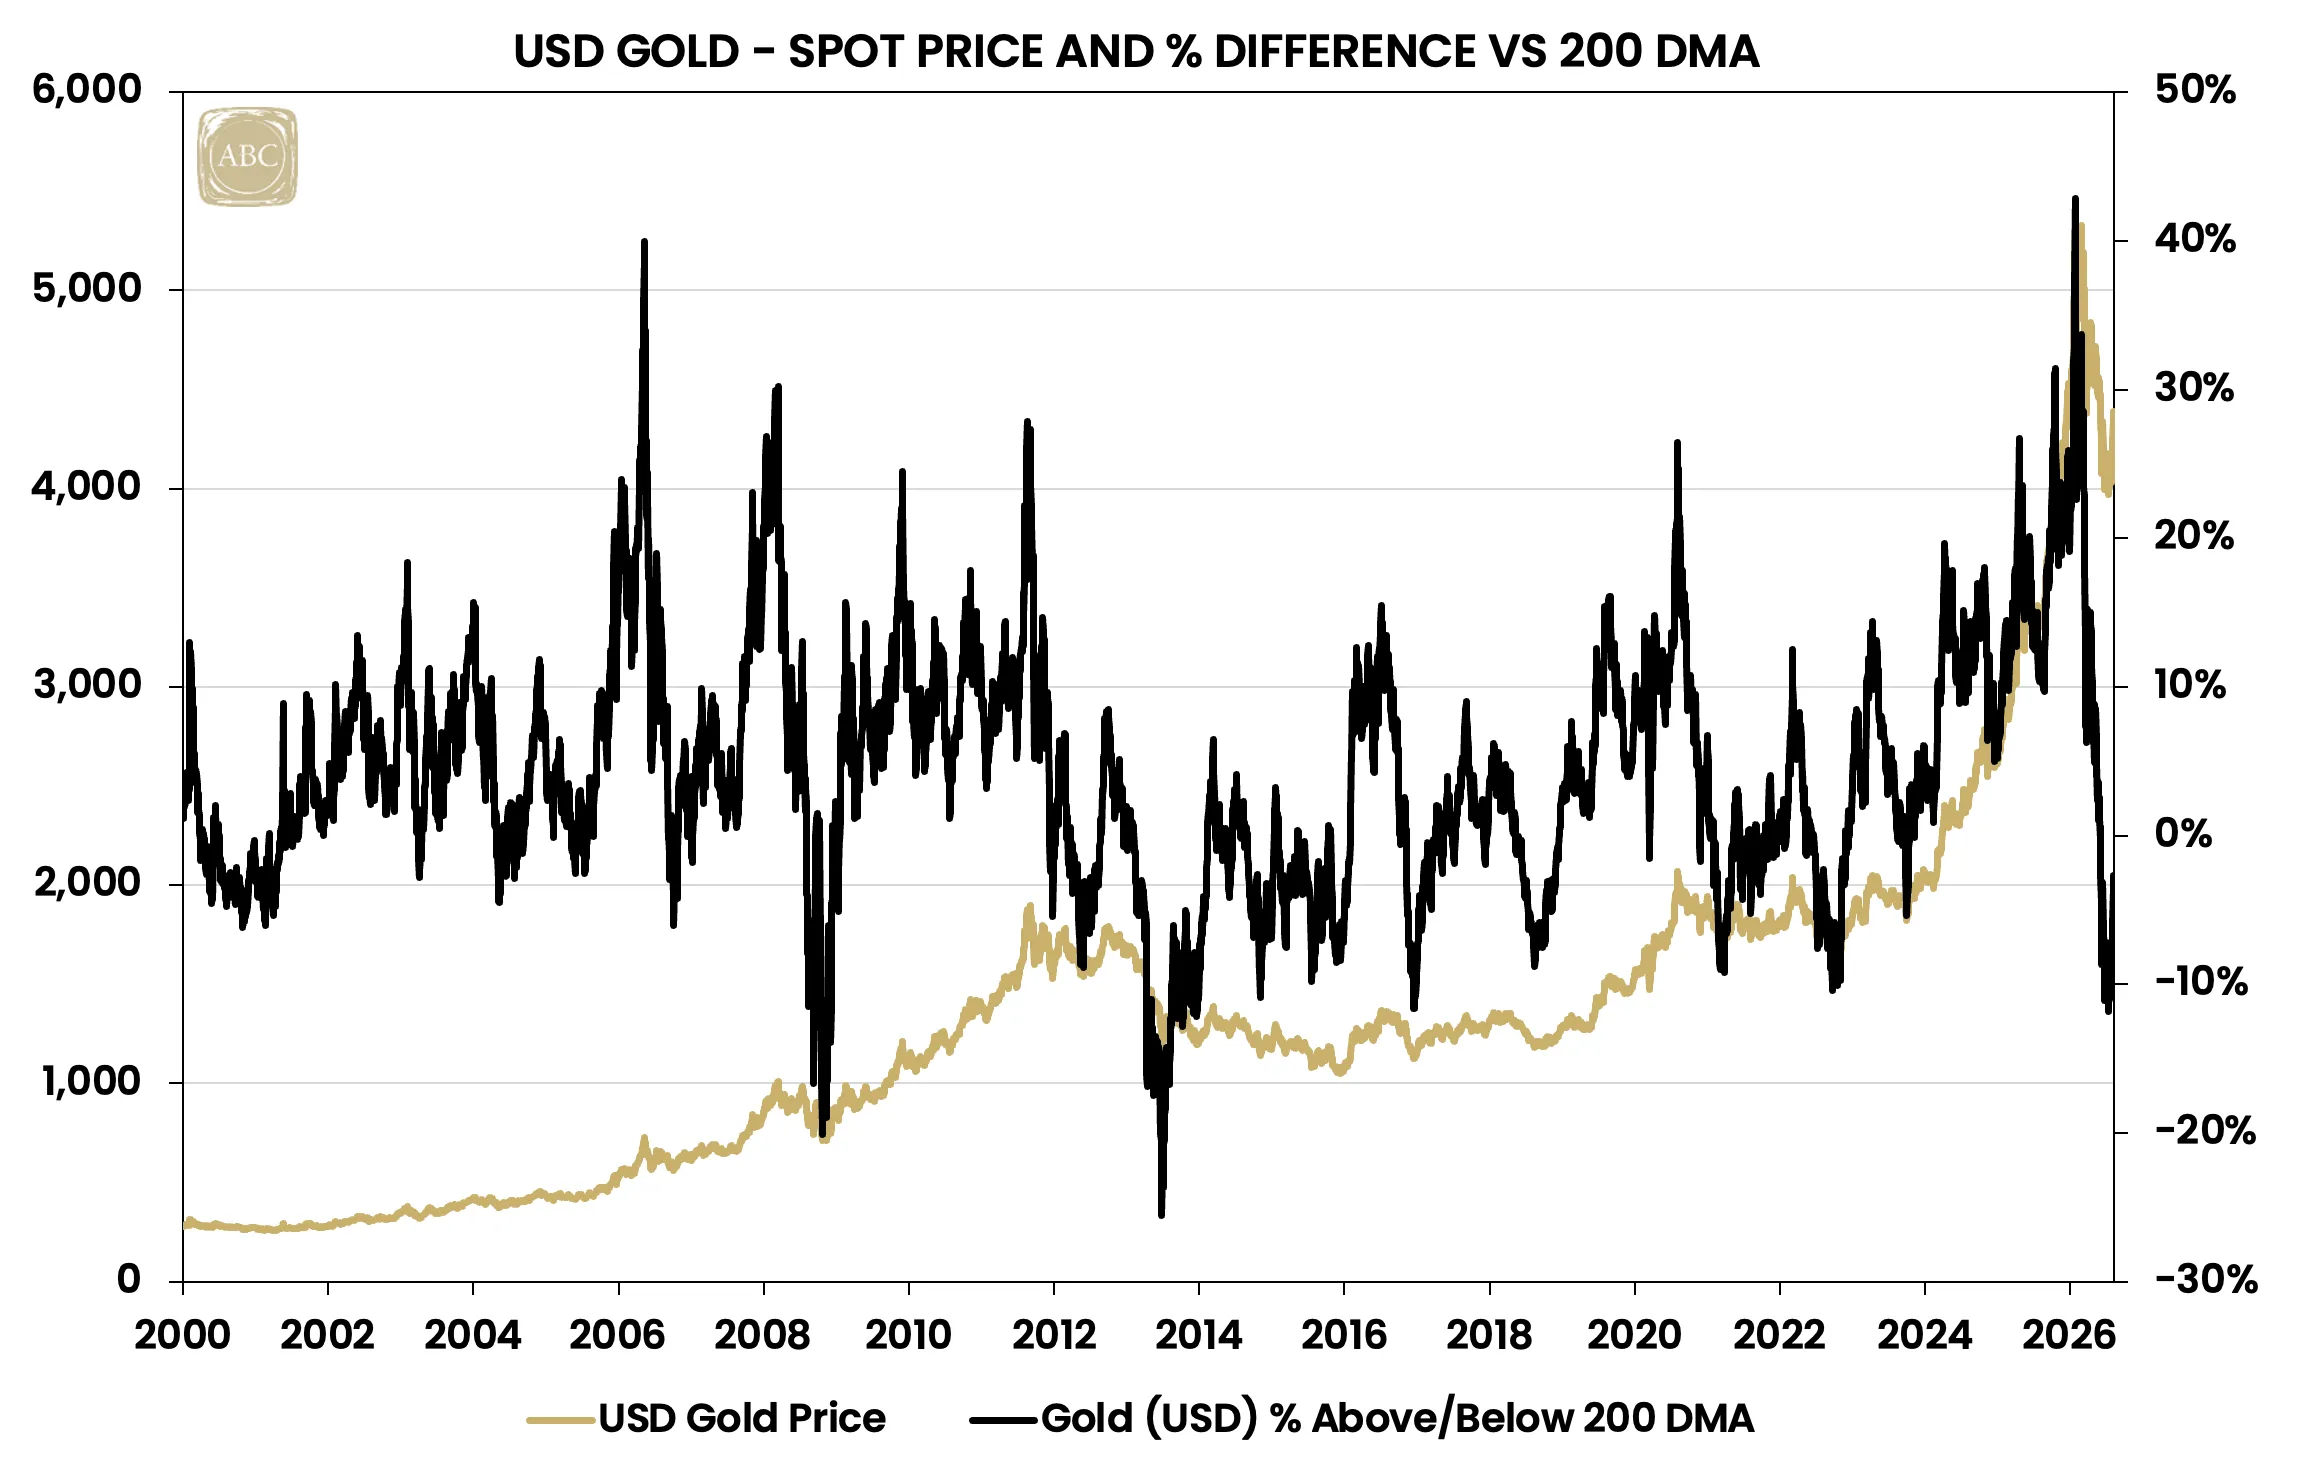
Source: LBMA, ABC Bullion
As you can see, the black line is volatile, indicating it is not uncommon for gold to oscillate between periods it is overbought (black line a long way above 0%) with these interim peaks followed by corrective periods in the market where gold ends up oversold (black line a long way below 0%).
Many of the key interim price peaks observable in the chart below are also highlighted in the table below, which also shows:
The USD spot gold price at each respective interim peak.
The 200-DMA price on the day spot gold hit these interim peaks, and how far above the 200-DMA spot gold was in percentage terms.
The USD spot gold price at each interim trough, or low in the price that followed each peak.
The 200-DMA price on the day spot gold hit the interim trough, and how far below the 200-DMA spot gold was in percentage terms when the trough was hit.
The total spot price fall in both dollars and percentage terms from the interim peak to the interim trough.
The time it took in calendar days for the corrective period from peak to trough to play out, as well as the days to recover to that peak.
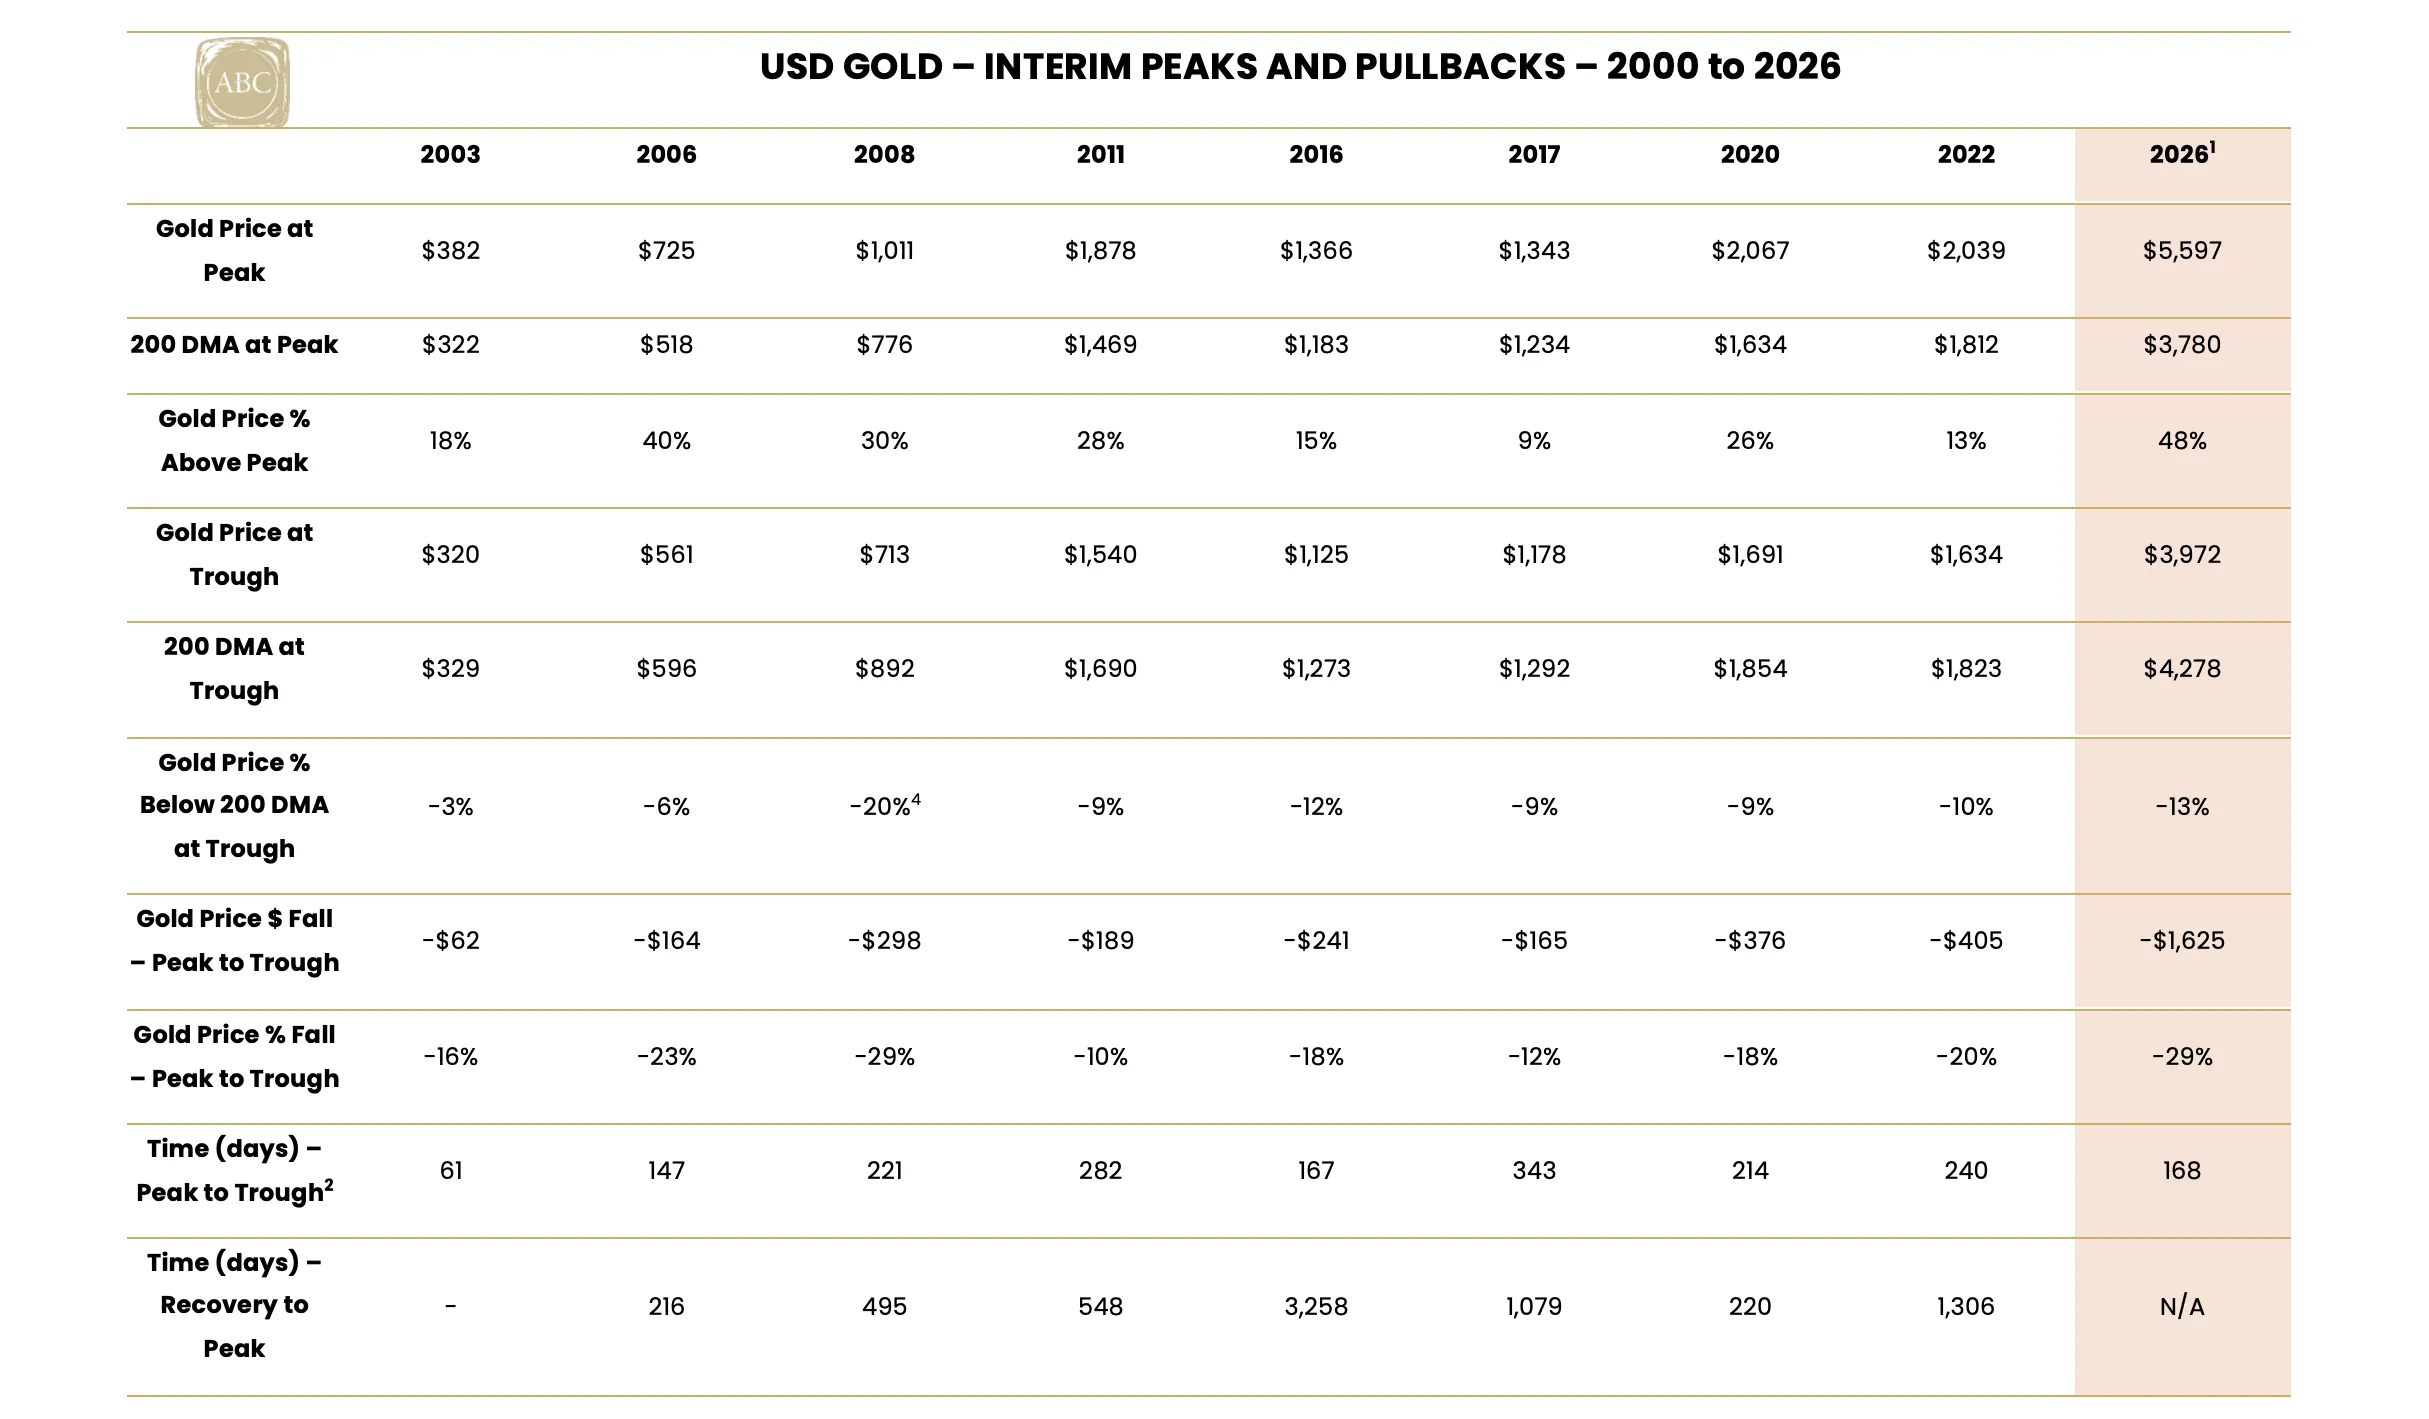
Source: LBMA, ABC Bullion. Notes: 1. Values represent pullback in current market cycle to 12 Aug 2026, with the low of $3,972 seen in mid-July, 2. Average historical peak to trough cycles back to is 209 days. 3. Average price % below trough is equivalent to 10% across market cycles. 4. Worst drawdown below 200 DMA. 5. Figures represent calendar days. 6. Average recovery to prior peak is 969 days.
The table makes it clear that in the periods that gold surges far above its 200-DMA and hits an interim peak, the pullback from that interim peak has typically ended with gold trading below its 200-DMA, something we saw play out again most recently in July following golds overstretched rally in months leading into end-January.
Analysis of this data also shows that, in the corrective periods between 2003 and 2022 (we have excluded the current pullback as its still playing out), gold:
Ended up trading 10% below the 200-DMA on the day it troughed (–8% if you took out the most extreme result) – 13% in current pullback
Took 209 days to fall from peak to trough (190 days if you took out most extreme result) – 168 days in current pullback
Took on average 969 days to recover to the prior peak (642 days if you took out the most extreme result)
Overall, the current correction broadly aligns with the historical trends observed across prior gold market cycles.
The depth of the pullback, the duration of the decline, and the extent to which gold moved below its 200-DMA all fall within historical norms, lending support to the view that the July low may prove to be a significant cyclical bottom.
We are likely to see much higher prices in the years ahead.
Until next time,

Jordan Eliseo
General Manager, ABC Bullion

Luke Tyler
Senior Analyst, ABC Bullion
Disclaimer: This document has been prepared by Australian Bullion Company (NSW) Pty Limited (ABN 82 002 858 602) (ABC). The information contained in this document or internet related link (collectively, Document) is of a general nature and is provided for information purposes only.. Although the information and opinions contained in this document are based on sources we believe to be reliable, to the extent permitted by law, ABC and its associated entities do not warrant, represent or guarantee, expressly or impliedly, that the information contained in this document is accurate, complete, reliable or current and accept no liability for any loss or damage relating to any use or reliance on the information in this document. The information is subject to change without notice and we are under no obligation to update it.