Shades of 2008 as Gold and Silver Rebound Strongly
05 November 2026
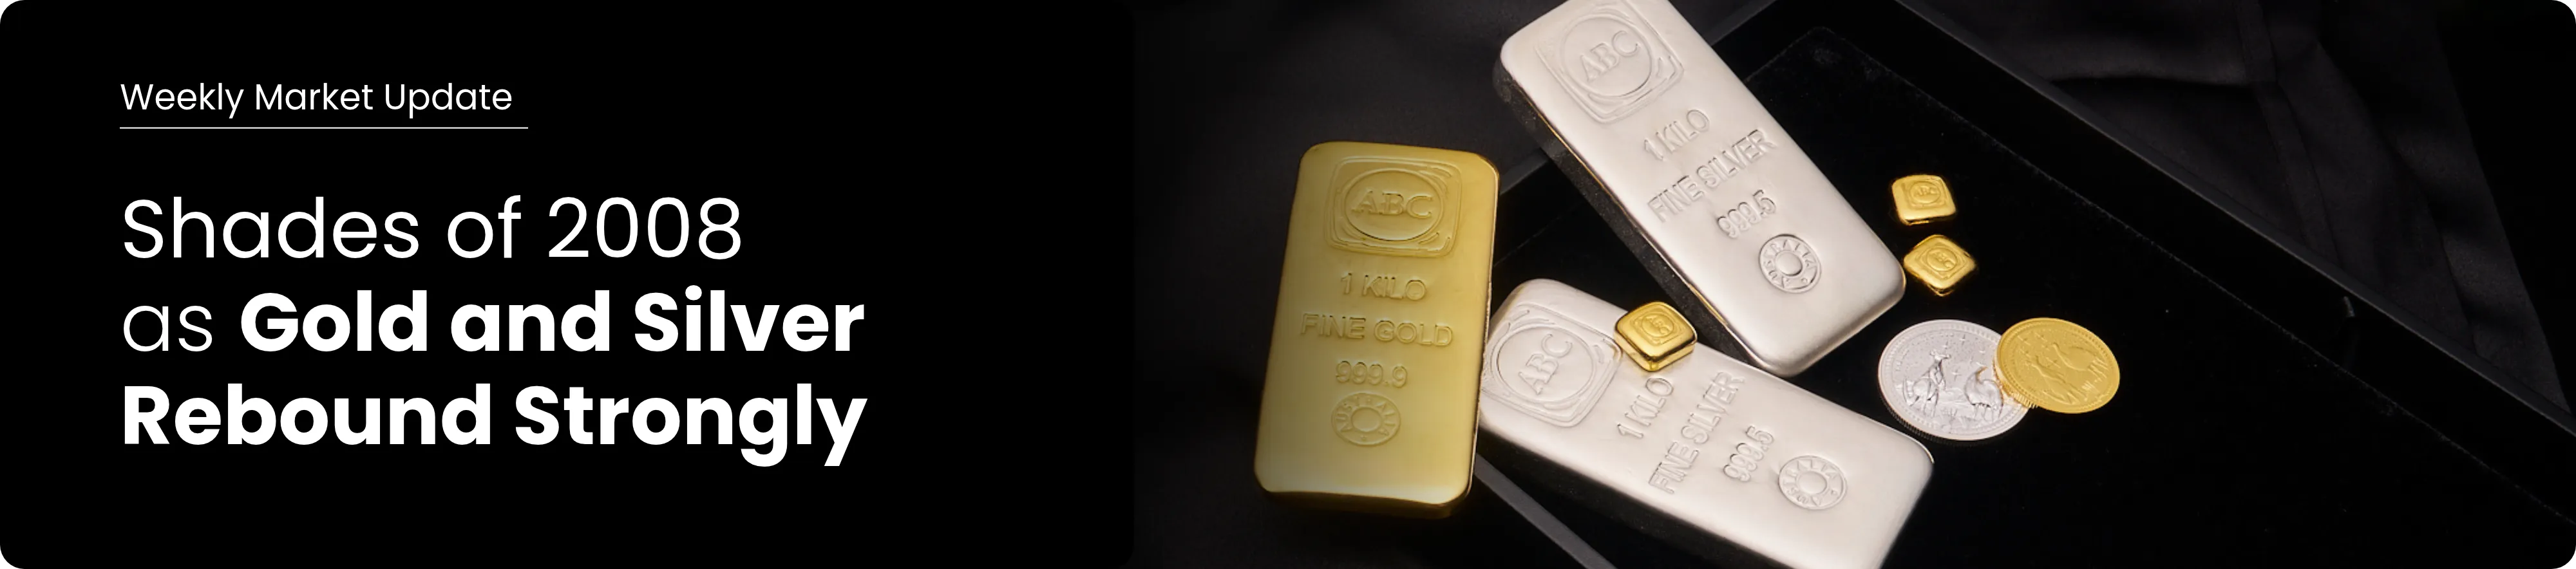
Precious metals markets have seen significant volatility in the last few trading days, with gold and silver suffering one of their largest daily sell-offs last Friday before rebounding strongly following the US midterm elections.
Gold fell 3.5% on Friday to around US$3,881 per troy ounce (oz), briefly hitting its lowest level in a year and breaking below the psychologically important US$4,000oz mark. Silver was hit even harder, falling 6.5% toward US$49oz, its first move below the psychologically significant US$50oz price point in this now 9-month corrective cycle.
The sell off in metals occurred against a backdrop of a broader technology-led equity market sell-off, continued inflation concerns and expectations that US interest rates will stay higher for longer.
The decline extended what has already been a significant correction across precious metals markets (gold has fallen almost exactly 30% in USD terms since the January peak), with silver's traditionally higher volatility again evident during Friday's move.
The sharp fall seen in precious metal prices last week saw gold record its worst October return since 2008. That was at the height of the Global Financial Crisis.
That turned out to be an incredible time to buy gold, which makes the response we have seen this week equally noteworthy, with gold rallying back above US$4,000oz, while silver has recovered to around US$52.50oz.
Most of that move has occurred in the past 24 hours following the US midterm elections, a resounding success for the Democrats, with falling Treasury yields and a weaker US dollar providing renewed support for an already oversold precious metals market.
Investors are also digesting the implications of the election result for US fiscal policy, political gridlock in Washington, and what it may mean for the conflict with Iran. While it is too early to declare the correction in gold and silver is now decisively over, the combination of fiscal concerns, geopolitical uncertainty and changing expectations for monetary policy should ensure precious metals remain firmly in focus.
Structural Demand for Gold Remains Strong
The volatility in gold prices has coincided with the release of the World Gold Council's Gold Demand Trends: Q3 2026, which provides an important reminder of the structural forces supporting the gold market.
Total gold demand reached 1,369 tonnes in Q3, almost unchanged relative to Q3 2025
Central banks remained one of the strongest sources of demand, with official sector purchases reaching 321 tonnes in Q3. That is up 42% year-on-year and comfortably above the five-year quarterly average of 227 tonnes. Year-to-date central bank buying has now reached 675 tonnes, 6% ahead of the same period in 2025. China and Poland were the largest reported purchasers during the quarter.
Physically backed gold ETFs attracted 211 tonnes of inflows during Q3, lifting global ETF holdings to a record 4,256 tonnes.
Retail demand was more subdued. Global bar and coin demand fell 19% year-on-year to 268 tonnes as investors waited for a clearer direction in prices. While the 19% drop might seem like a huge decline in demand, it should be noted that calendar year to date, bar and coin demand reached 1,053 tonnes, its strongest January-to-September period since 2013.
The divergence is instructive. While short-term price volatility has made some retail investors more cautious, central banks and institutional investors continue to allocate significant capital to gold.
Higher Rates Hit Property as Australian Households Under Pressure
Closer to home and the Australian economic backdrop has become more challenging.
The Reserve Bank of Australia (RBA) lifted the cash rate to 4.85% on Melbourne Cup day earlier this week, the fifth interest rate increase of 2026. The move was widely expected, with the RBA citing persistently high and broad-based inflation, which it now expects to remain above 3% until the end of 2027 at a minimum.
Those higher rates are being felt across the economy (evidenced by the troubles seen in discretionary retail, including David Jones), but nowhere is the pain more evident than the slowdown in the housing market.
Combined capital-city dwelling values are now estimated to have fallen by around 8.5% from their March peak, with price falls now being seen across every capital city nationwide. The pullback, which will almost certainly see house prices down by 10% by Christmas 2026, represents the biggest correction in decades.
Sales volumes across the capitals have also fallen notably, with data from the three months to end October showing a 26% decline relative to a year earlier. The cumulative impact of higher mortgage rates, and higher value home loans has also materially increased repayments and reduced household borrowing capacity.
For Australian investors, these developments are significant.
For decades, residential property has played an outsized role in household wealth creation, supported by falling interest rates, expanding credit and rising property valuations. The environment today is very different, with higher interest rates, elevated household debt and weakening property prices looking like it will punch a multi-trillion dollar hole in Australian household wealth.
At a minimum, this will encourage investors to think more differently about diversification, sources of capital growth and the role of alternative stores of wealth like physical bullion.
These are themes we explore in detail in our latest report, Gold and the Great Australian Dream, which examines long-term developments in the Australian residential property market, long-term gold to house price ratios, and what changing economic conditions could mean for investors in the years ahead.
Until next time,

Jordan Eliseo
General Manager, ABC Bullion
Disclaimer: This document has been prepared by Australian Bullion Company (NSW) Pty Limited (ABN 82 002 858 602) (ABC). The information contained in this document or internet related link (collectively, Document) is of a general nature and is provided for information purposes only.. Although the information and opinions contained in this document are based on sources we believe to be reliable, to the extent permitted by law, ABC and its associated entities do not warrant, represent or guarantee, expressly or impliedly, that the information contained in this document is accurate, complete, reliable or current and accept no liability for any loss or damage relating to any use or reliance on the information in this document. The information is subject to change without notice and we are under no obligation to update it.