Gold Price Increases You Can Bet Your House On
06 August 2026

Gold and silver have both performed strongly in the past week. At the time of writing, gold is trading at USD $4,270 per troy ounce (oz), up roughly 4.1% from this time last week, having traded in the range of USD $4,018–$4,281 per ounce. Silver saw greater gains, up about 5.2% to USD $62.1oz, with a USD $56.5oz–$62.8oz range.
Gold continues to be driven predominantly by shifting inflation and rate expectations, showing signs of a potential recovery in recent days, off the back of a prospective interim deal to reopen the Strait of Hormuz. Lowering oil tempered inflation concerns (WTI Crude Oil futures falling ~14%, currently trading below USD $75/BBL) and reduced U.S. rate hike probabilities, though markets are still pricing about a 57% chance of a September Fed hike (CME Group).
This is following a divided Fed which held rates steady in July, citing, “expanding economic activity at a solid pace, strong productivity growth and capital investments as well as an unchanged unemployment rate,” as drivers of the decision (FOMC).
Even if the Fed doesn’t move in September, it appears just a matter of time. Markets are pricing in an almost certain 25 basis point rate hike by the end of 2026, with the Fed noting that, “inflation remains elevated relative to the Committee’s 2% goal, in part reflecting supply shocks that have driven price increases in certain sectors, including energy.” (FOMC) All eyes will be on the upcoming payrolls, unemployment and inflation data for further clarity on the Fed's policy path and the timing of its next move.
Risk assets experienced a similar rebound off the back of the potential reopening of the Strait of Hormuz, led by the Philadelphia Semiconductor Index and the tech-heavy NASDAQ up 17% and 9% respectively since last Wednesday. This spike happened amid renewed optimism in the AI trade and strong earnings results, despite signs of extreme overvaluation historically speaking (Shiller PE ratio above 42 compared to historical average of 17). The ASX 200 also demonstrated stronger performance (+2.7%) off the back of technology and material sector gains (AFR).
That same inflation and rates story is just as relevant in Australia, where households remain exposed to the delayed impact of higher borrowing costs and sticky domestic price pressures amid the ongoing global fuel crisis.
While headline inflation has eased from its peak (+3.8% in the 12 months to June 2026, down from 4.0% in May), trimmed mean (core) inflation continues to persist at problematic levels (+3.6% annually for the 12 months to June 2026, remaining unchanged from May). Electricity remains one the largest contributors to annual inflation, with costs 22.4% higher than they were 12 months ago, largely driven by the ending of government rebates to household electricity bills (ABS).
Non-tradable inflation also remains sticky at 4.9% in the 12 months to June 2026 (up from 4.7% in the 12 months to May), which continues to reflect domestic cost pressures rather than imported price shocks alone(ABS). This leaves the RBA with limited flexibility, as any premature easing risks reigniting inflation expectations, particularly if the Australian dollar weakens and adds pressure to tradable goods prices.
For households, this means the higher-rate environment may remain in place for longer than many borrowers would like, with CBA forecasting that a rate cut remains unlikely before May 2027 (CBA). This will continue to put upward pressure on mortgage repayments, while limiting borrowing capacity and discretionary spending over the near-term.
This is where the pressure on housing becomes more apparent. Australian property has benefited for decades from falling rates, expanding credit, favourable tax benefits and strong population growth, but that model is being tested. This is evident through the most recent Cotality data published, which showed home prices nationally on average fell 0.7% in July, the largest monthly decline in almost four years. Capital cities dropped by an average of 0.9%, with Sydney and Melbourne leading the charge, falling 1.4% and 1.2% respectively.
That the Australian property market is showing increasing signs of weakness is no real surprise, with conditions deteriorating following the May budget announcements. The removal of negative gearing for established properties and the ban on SMSF borrowing via LRBAs were the most notable changes having an almost instantaneous impact on the property market. This, combined with three consecutive rate hikes by the RBA starting in February of this year, has reduced investor confidence and stretched affordability for investors.
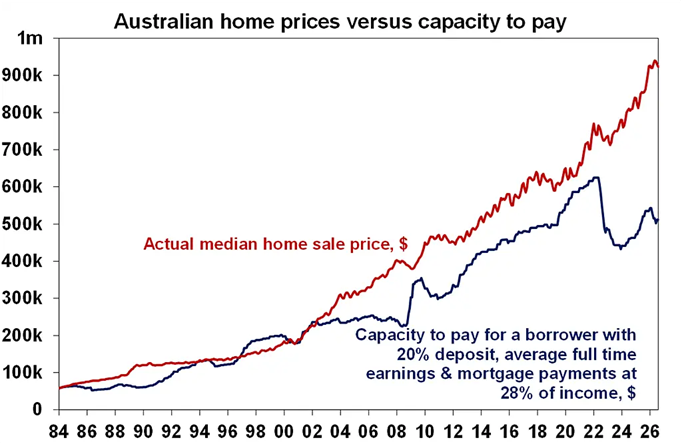
The ongoing erosion of housing affordability in Australia is evident in the chart below, illustrating that the ratio of home prices to wages and incomes remains close to historical highs. When coupled with elevated mortgage rates, affordability has worsened significantly, placing home ownership further out of reach for many Australians (AMP).
Despite these challenges, several key tailwinds continue to support the property market. Most notably, Australia remains constrained by a structural undersupply of housing which has persisted since 2007, with the current undersupply in the range of 200,000 to 300,000 dwellings (AMP), seen in the chart below.
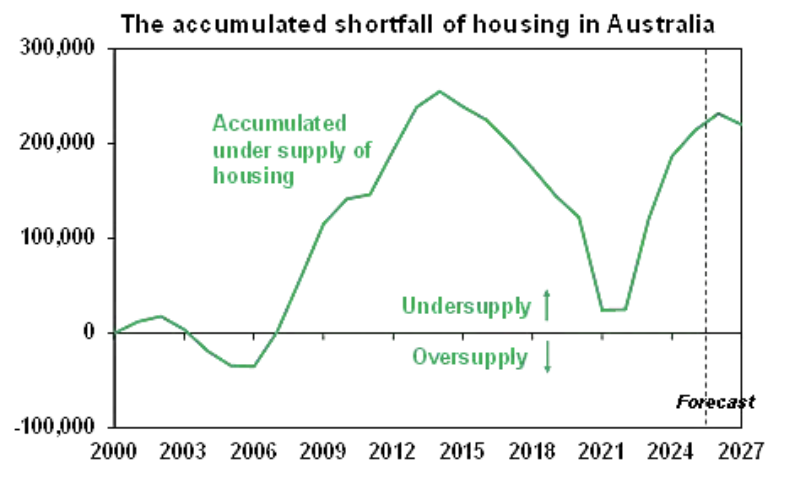
This imbalance has been exacerbated by record levels of net overseas migration post-COVID. With higher interest rates, increasing construction costs (up 50% since pre-COVID), labour shortages and planning constraints continuing to hinder new housing supply, it is unlikely the supply side of the housing equation will be resolved in the near term. Additionally, the expansion of the 5% First Home Deposit scheme is expected to provide ongoing support for entry-level housing demand, helping underpin activity at the lower end of the market.
The bottom line is that while markets remain focused on the timing of future rate cuts, inflation continues to prove more persistent than many had anticipated both in Australia and globally. This has provided ongoing support for gold, while simultaneously creating challenges for interest rate-sensitive assets such as residential property.
In Australia, stretched affordability, weaker borrowing capacity and recent policy changes are beginning to weigh on housing demand, although a structural undersupply of dwellings and record levels of immigrationcontinue to provide support. Against this backdrop, investors may need to temper future expectations for property returns and recognise that the higher-for-longer interest rate environment remains a constructive backdrop for precious metals.
We will have more to say on this in the coming weeks, with updated articles and charts looking at relative valuations between gold and the Australian property market.
Until next time,

Jordan Eliseo
General Manager, ABC Bullion

Luke Tyler
Senior Analyst, ABC Bullion
Disclaimer: This document has been prepared by Australian Bullion Company (NSW) Pty Limited (ABN 82 002 858 602) (ABC). The information contained in this document or internet related link (collectively, Document) is of a general nature and is provided for information purposes only.. Although the information and opinions contained in this document are based on sources we believe to be reliable, to the extent permitted by law, ABC and its associated entities do not warrant, represent or guarantee, expressly or impliedly, that the information contained in this document is accurate, complete, reliable or current and accept no liability for any loss or damage relating to any use or reliance on the information in this document. The information is subject to change without notice and we are under no obligation to update it.