Gold Surges as Australian Investors Turn Away From Property Market
20 August 2026

Precious metal prices surged overnight, with gold pushing above the key USD $4,500 per troy ounce (oz) price point.
At the time of writing, gold is trading at USD $4,512oz, delivering a weekly return of 3.7%. Silver experienced similar returns, rising 3.9% to USD $67oz. The gold-to-silver ratio (GSR) remained unchanged at 67.
In local terms, precious metals returns didn't see as strong of a bounce, with gold currently trading at AUD $6,332oz (+2.6%), and silver at AUD $88.7oz (+2.8%). The appreciation of the value of the Australian dollar vs the greenback to 0.7125 (+1.1%) limited gains for Australian investors.
U.S. and local equity markets underperformed, with the S&P 500, NASDAQ and ASX 200 falling 1.2%, 1% and 1% respectively. This trend pairs with the heavy tech sell-offs, as well as elevated oil prices and rising government bond yields, which have weighed on markets over the past week (Yahoo Finance). Bitcoin surged, gaining 9.7% week-on-week to USD $69,637.
This USD $175oz surge in gold prices overnight was driven by a sharp fall in the U.S. 30Y Bond Yield which fell more than 10 basis points to 5.189% from Tuesday’s 19 year historical high of 5.308%, after the Treasury Department announced it would double the size of liquidity support buy-back operations for longer-dated bonds (Reuters).
The macroeconomic environment shows a significant uprise in crude oil prices following the breakdown of U.S.-Iran negotiations and the end of the two-month ceasefire. WTI crude oil futures rose to just below USD $86/BLL (+6% week-on-week) as uncertainty increases on Iran’s decision regarding the Strait of Hormuz and U.S. bombing threats toward Oman.
Inflation and financial markets are facing continued pressure due to rising oil prices (CBA), consequently increasing expectations of a Fed rate hike towards the end of this year, with traders currently pricing in a ~68% probability of a hike (CME Group).
"Inflation and financial markets are facing continued pressure due to rising oil prices, consequently increasing expectations of a Fed rate hike towards the end of this year."
The Australian Property Market
Australian property prices continued to fall throughout July, seen through Cotality’s national Home Value Index (HVI) falling 0.7% (Cotality). Sydney and Melbourne continued to lead the pullback (-1.4% and -1.2% respectively), while values in Brisbane (-0.6%) and Canberra (-1%) were also materially lower month-on-month.
It should be noted that the upper end of the market has been significantly more impacted, seen through upper-quartile home values falling -3.2% nationally over the three months to July, compared with a 0.3% gain across the lower price tier. This appears to reflect the expansion of the 5% First Home Deposit scheme, combined with the lagged impact of three consecutive RBA rate rises since February 2026, which has reduced investors’ borrowing capacities and prompted many of them to shift their focus toward lower-priced segments of the market.
The macro picture behind these prices changes remains relatively unchanged since our latest update.
Demand continues to be negatively impacted by a combination of:
The May budget changes, consisting of the removal of negative gearing for established properties and the ban on SMSF borrowing via LRBAs.
Three consecutive rate hikes by the RBA starting in February of this year, pushing the cash rate to 4.35% by June.
Ongoing erosion of housing affordability in Australia, seen through the growing deviation between median house prices and investors’ capacity to pay.
Despite this, the supply side remains bullish in the sense that:
The Australian housing market remains in a structural undersupply, which has persisted since 2007, with the current undersupply in the range of 200,000 to 300,000 dwellings.
The ongoing undersupply has been exacerbated in recent years by increasing construction costs (up 50% since pre-COVID), labour shortages and planning constraints combined with record levels of net overseas migration post-COVID.
Migration policy remains a key variable for the Australian housing market. While One Nation's proposal to reduce annual visas to 130,000—potentially resulting in zero or negative net migration—would significantly weaken housing demand, Labor's current plan to reduce net migration from around 300,000 to 225,000 over the next two years (SMH) is unlikely to have the same material impact.
What Does This Mean for Gold?
Over the past five decades, Australian residential property has delivered strong nominal capital growth, with the national median house price rising from just $16,333 in 1970 to more than $1 million by June 2026 (CAGR of ~8%). However, when measured against gold, a very different picture emerges. While house prices have increased approximately 61-fold over this period, gold has risen more than 200-fold in Australian dollar terms (CAGR of ~10%).
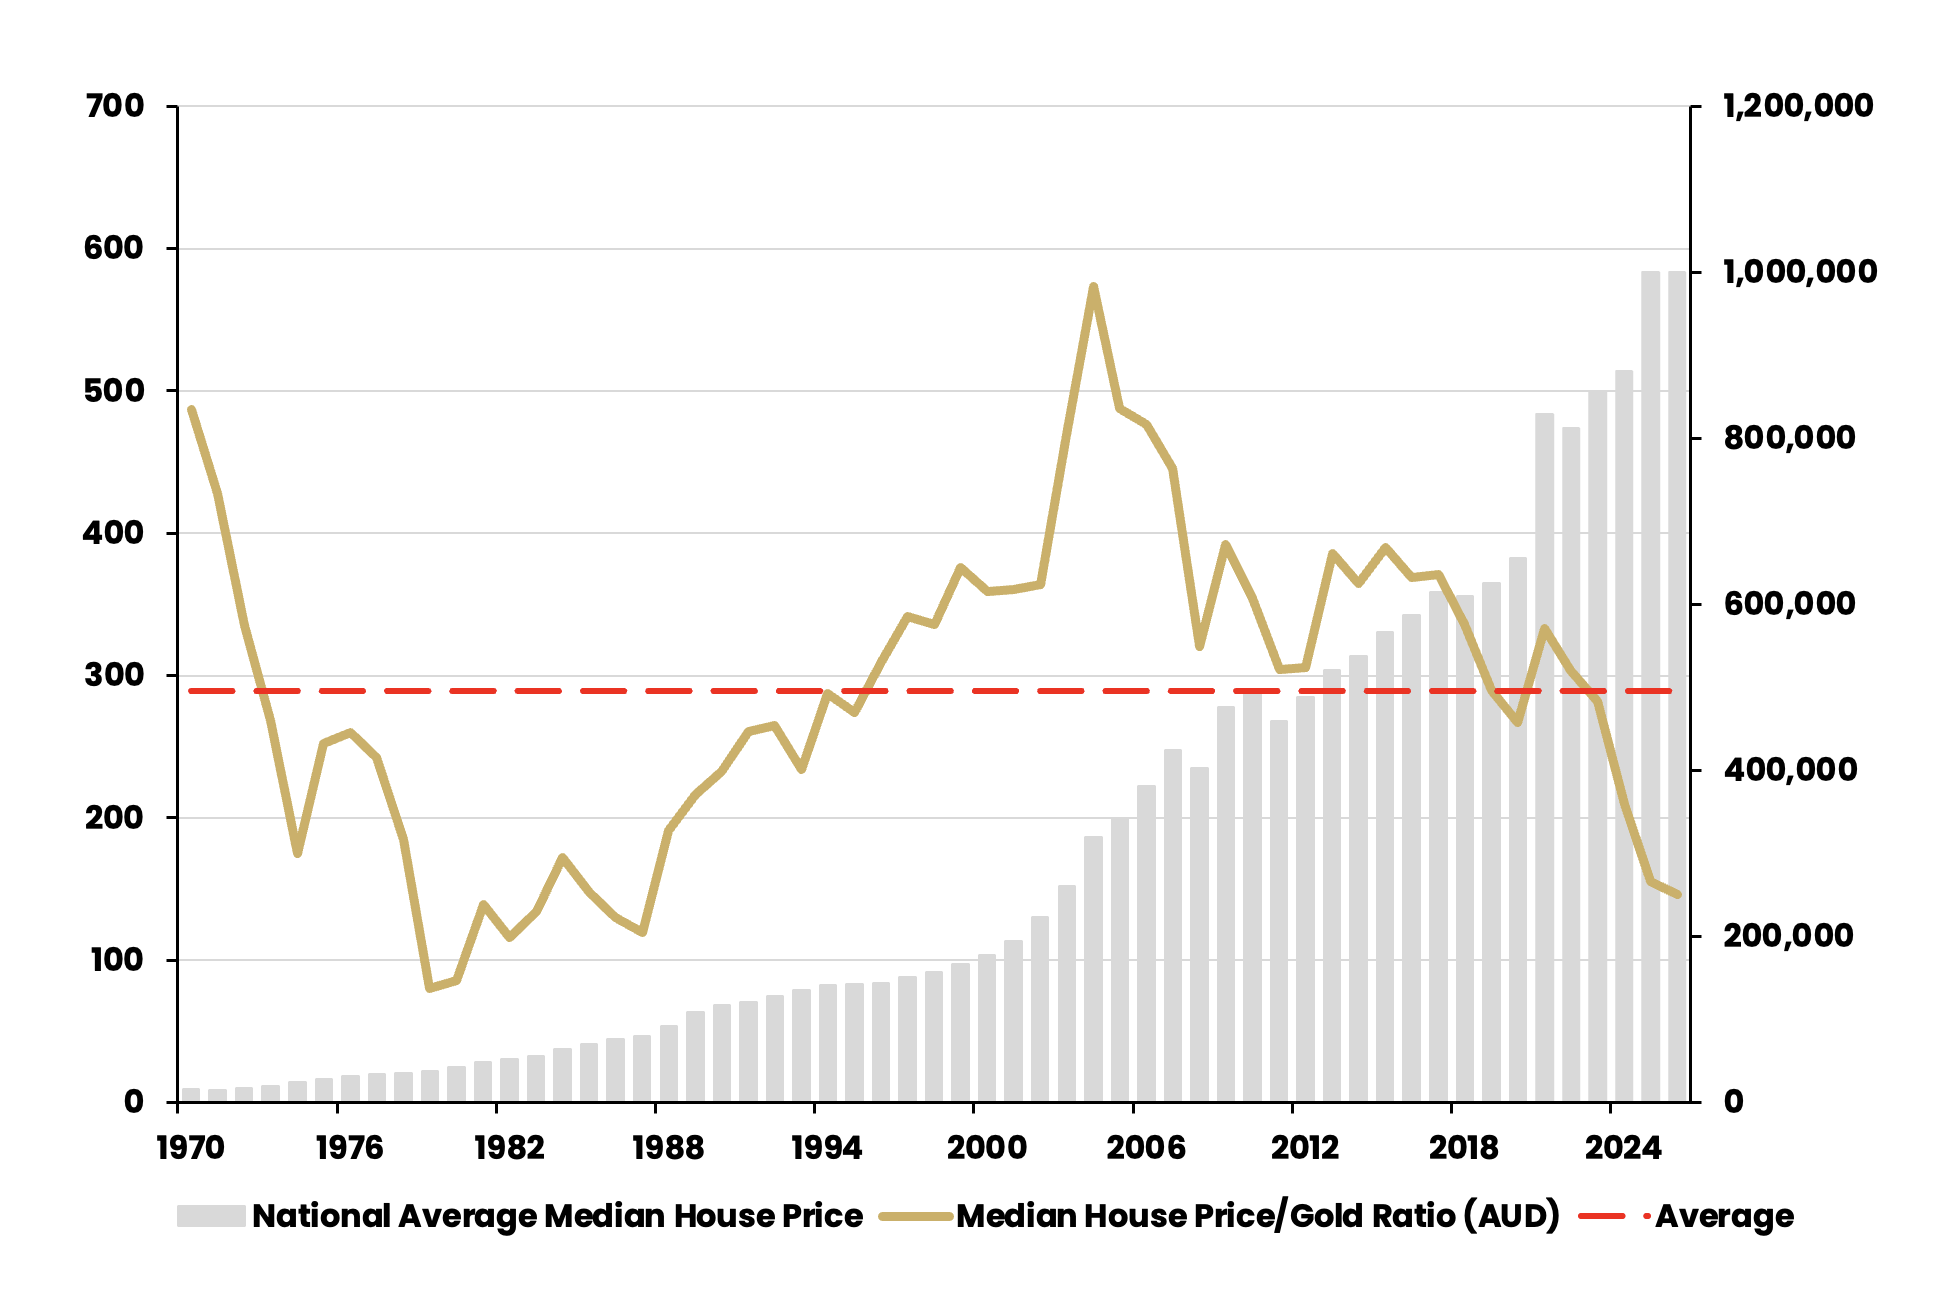
The chart below illustrates the ratio of the national median house price to the Australian dollar gold price since 1970 or in other words, the number of ounces of gold (in Australian dollar terms) required to purchase the national median property each year.
The long-term average sits at approximately 289 ounces of gold, represented by the red dashed line. Periods where the ratio rises substantially above this level indicate that property is expensive relative to gold, while periods below the average suggest the opposite.
Source: LBMA, ABS, Cotality, ABC Bullion
Several notable extremes stand out. During the early 2000s property boom, the ratio surged to a record high of around 573 ounces (2004), meaning it required more gold (almost 18 kilos) than at any other point in the period to purchase the median Australian home. This period between 1990 and 2004 reflected a combination of rapidly rising house prices (national median house price increasing ~2.7x) and a gold market that was almost flat delivering a total return of just 11%.
Throughout this period, interest rates fell significantly in Australia, from their 1990 historical highs of 17%, to a low of 6% in 2002, with lowered borrowing costs improving accessibility to housing investment. As well as strong economic growth, deregulation of the financial system in the 1980s/1990s and the introduction of the 50% Capital Gains Tax Discount in 1999 also stimulated property demand.
Conversely, the late 1970s and early 1980s saw the ratio plunge to a historical low of 80 ounces (less than 3 kilos) as gold prices surged in the years following the abandonment of the gold standard by President Nixon in 1971, where gold outperformed property significantly, rising ~20x vs property’s ~5x (1971-1987).
This period was characterised by persistently high inflation, weak economic growth (stagflation) and sharp increases in interest rates (highs of 13% in Australia), with borrowing costs reducing housing affordability nationwide. This period also coincided with the Hawke Labor government removing negative gearing (similar to what we saw in the 2026 Federal Budget) for residential property in 1985, only to reinstate it two years later amid a collapse in the rental market.
Today, the ratio between gold and housing sits closer to 160 ounces (exactly 5 kilos), approximately half its long-term average and among the lowest readings recorded since 1987.
"Today, the ratio between gold and housing sits closer to 160 ounces (exactly 5 kilos), approximately half its long-term average."
While the ratio remains in a clear downtrend and is approaching previous cyclical lows near 80 ounces, a return to those levels would require a substantially higher gold price if Australian property prices remained broadly unchanged. Based on the current median national house price, a ratio of 80 would imply a gold price of approximately AUD $12,500oz, representing an increase of around 100% from current levels.
The previous peak-to-trough cycle in the ratio unfolded over approximately 25 years, from 1979 to 2004. By comparison, the current cycle is around 22 years removed from its 2004 peak, suggesting there is still scope for gold to continue outperforming residential property in the current cycle. This possibility is further supported by a macroeconomic backdrop characterised by elevated government debt, persistent inflation risks, ongoing central bank gold purchases and geopolitical uncertainty—all of which have historically been supportive of gold.
While valuation metrics alone cannot predict future returns, the historical relationship between Australian residential property and gold has exhibited a strong tendency towards higher peaks and lower lows, followed by mean reversion that plays out over long-term market cycles.
These shifts have largely been driven by changes in economic conditions, interest rate environments and government policy settings, resulting in alternating periods where either property or gold has proven to be the superior store of wealth.
Until next time,

Jordan Eliseo
General Manager, ABC Bullion

Luke Tyler
Senior Analyst, ABC Bullion
Disclaimer: This document has been prepared by Australian Bullion Company (NSW) Pty Limited (ABN 82 002 858 602) (ABC). The information contained in this document or internet related link (collectively, Document) is of a general nature and is provided for information purposes only.. Although the information and opinions contained in this document are based on sources we believe to be reliable, to the extent permitted by law, ABC and its associated entities do not warrant, represent or guarantee, expressly or impliedly, that the information contained in this document is accurate, complete, reliable or current and accept no liability for any loss or damage relating to any use or reliance on the information in this document. The information is subject to change without notice and we are under no obligation to update it.