Precious Metals Steady as Housing Continues to Weaken
10 September 2026
Precious metal markets traded in a narrow range this week, with gold steadying just near USD $4,400 per troy ounce (oz) at the time of writing, while in local currency terms, gold is sitting just above AUD $6,100oz.
Silver has fared slightly better in the past week, approaching USD $67.50 and AUD $93.50oz, with resilient consumer demand, ETF inflows in late August, and central bank buying all providing support.
The market looks like it may remain in a trading range for the foreseeable future, with gold challenged in the short-term at or near USD $4,500oz at the upper end, while there is very strong support in the $4,000-$4,200oz range, though any changes to the situation in the Middle East, or a repricing of US rate expectations will likely see a pick up in price swings.
While lulls like this tend to mean gold generates less media attention and excitement, the long-term rationale for owning bullion remains undiminished.
Debt levels continue to rise, with the US Federal Government debt recently topping USD $40 trillion (and growing at almost USD $2 trillion a year), while stocks continue to show signs of weakness, with the S&P 500 pulling back by 1.5% in the past month.
Bond yields also continue to rise, with US 10 year government bonds now approaching 4.80%, a huge increase considering they were trading below 4% at one point in October last year.
Property markets also continue to exhibit signs of fragility, with Australia front and centre.
Indeed, the local property market continues to experience an overall downturn following its peak in February of this year, with the national average declining 0.9% throughout August and 3.1% within the last quarter. Sydney has led the charge, but Melbourne has followed closely, declining monthly, quarterly and annually by 1.1%, 4.7% and 4.6% respectively (Cotality).
Inflationary pressures continue to be felt onshore here in Australia, evident through sticky inflationary data and the RBAs subsequent three consecutive rate hikes in February, March and May, bringing the target cash rate from 3.85% to 4.35% (RBA).
As of July, headline CPI remains above the RBA’s 2-3% target band at 3.5%, with trimmed mean inflation unchanged at 3.6%. Forecasts for August expect headline CPI to rise to 3.9%. These rising inflationary expectations, combined with the Labor governments May budget announcements, have been the primary catalysts for the pullback in Australian property prices.
The challenges are only likely to mount from here, with all the big four banks now predicting another 25bp cash rate hike as early as September, which would bring the target cash rate up to 4.6%. RBA Deputy Governor Andrew Hauser this week in an interview identified inflation as the key challenge facing Australia's economy, highlighting Middle East tensions, the AI investment boom and weak productivity as the primary contributors to the persistent inflationary risks we see, while reiterating that further rate hikes remain likely.
If this scenario were to play out, it will generate higher borrowing costs for investors and further dampen property demand, likely driving prices lower.
The Melbourne Property Market
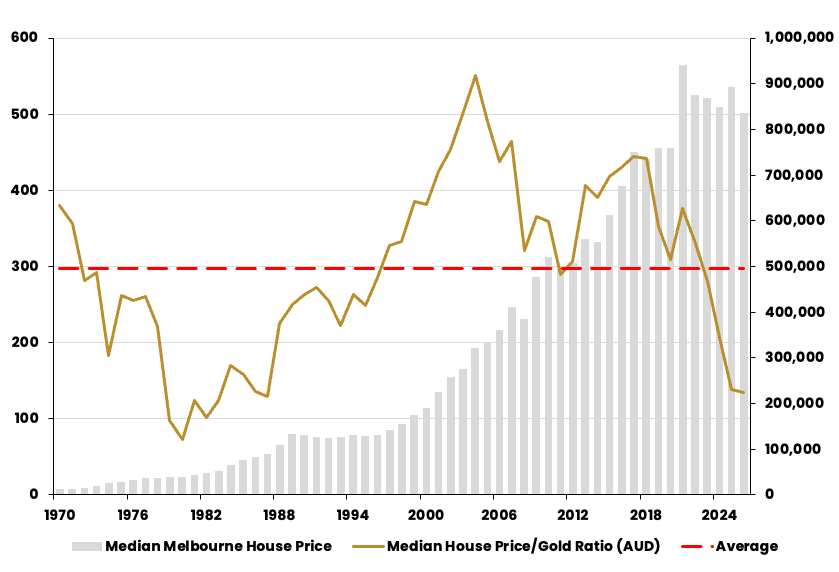
The chart below visualises the ratio of the median Melbourne house price to the Australian dollar gold price since 1970, represented by the gold line, depicting the number of ounces of gold (in Australian dollar terms) required to purchase the median property value in Melbourne each year. The chart also overlays the average of the ratio and the median Melbourne house price in dollar terms, represented by the red dashed line and grey bars respectively.
Source: LBMA, ABS, Cotality, ABC Bullion
The long-term average of the ratio sits at approximately 297 ounces of gold. Periods where the ratio rises substantially above this level indicate that property is expensive relative to gold, and periods below the average suggest the opposite.
Several pronounced extremes stand out, broadly following the historical market context previously discussed (ABC Bullion). The trough of the ratio (72 ounces of gold) in 1980 came about following golds price surge in the years following the abandonment of the gold standard by President Nixon in 1971, where gold outperformed property significantly. During this period, persistently high inflation and sharply rising interest rates—which reached 13% in Australia—also weighed on property investors.
The ratio then rose almost uninterrupted for 25 years, peaking at 551 ounces (or more than 17kg) in 2004, driven both by the two decade bear market in gold from 1980 to 2000, and the surge in Australian property prices over this period.
As of end August 2016, the ratio sits closer to 135 ounces of gold, approximately half its long-term average and at its lowest level since 1987.
A Tale of Two Cities
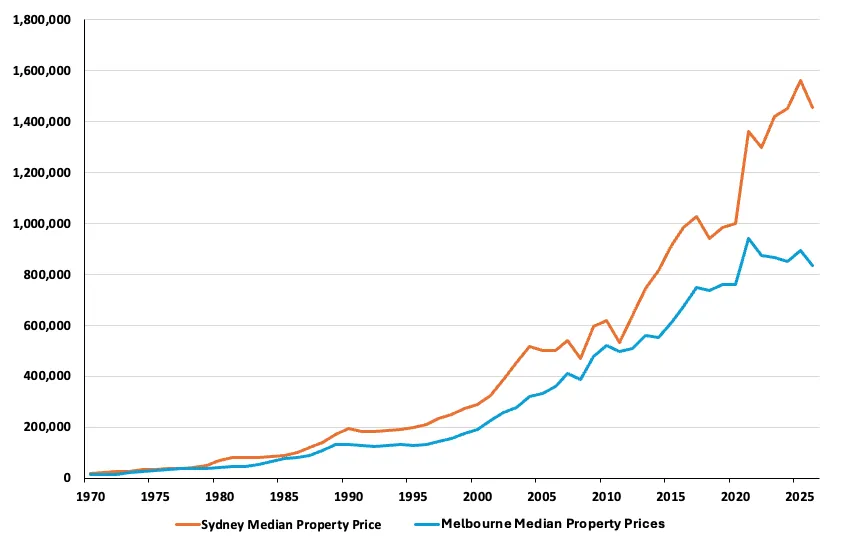
Although these fluctuations broadly reflect trends across the Australian property market, closer analysis reveals several important distinctions between the country’s two largest housing markets, as evidenced in the below chart, which compares median property price growth in Sydney (orange) and Melbourne (blue).
Both followed similar trends from 1970 to 2022 before diverging, as Sydney prices rose while Melbourne declined due to differences in supply, demand and Victorian land tax reforms.
Source: ABS, Cotality, ABC Bullion
Sydney’s harbour, Blue Mountains, national parks, hills and reservoirs constrain developable land. Melbourne’s flatter landscape supports greater construction, with 46,530 dwellings approved in FY2024–25—38.6% more than Sydney’s 33,573 (Buildstreet). Sydney homes also cost more to develop, with red tape, taxes and fees comprising 50% of prices versus 43% in Melbourne. Combined with tighter land constraints, these costs widened the price gap between the cities.
Melbourne’s decline also reflects weaker investor confidence following post-COVID Victorian land tax reforms. Higher borrowing costs pushed investors out nationwide, but Melbourne’s abundant supply outpaced demand, while Sydney benefited from scarcity and stronger overseas investor demand.
Melbourne’s post-2022 decline was compounded by Victoria’s 2024 COVID Debt Repayment Plan (Bruce Edmunds). Reforms cut the tax-free threshold for non-owner-occupied land from $300,000 to $50,000, raised the rate by 0.1% above $3 million, added a $975 surcharge and doubled the absentee owner surcharge from 2% to 4%, prompting an investor exodus.
While Melbourne’s underperformance since 2022 can largely be attributed to state-specific factors, the broader Australian property market is now facing many of the same headwinds that historically coincided with periods of precious metals outperformance, namely elevated inflation, rising interest rates and weakening investor confidence.
With Melbourne's house price-to-gold ratio already sitting near multi-decade lows and national property prices showing signs of further weakness, investors may increasingly question whether the next phase of wealth preservation and capital growth come from, with more Australian’s likely to turn to gold, given its historically strong performance during similar macroeconomic environments to the one we face today.
Until next time,

Jordan Eliseo
General Manager, ABC Bullion

Luke Tyler
Senior Analyst, ABC Bullion
Disclaimer: This document has been prepared by Australian Bullion Company (NSW) Pty Limited (ABN 82 002 858 602) (ABC). The information contained in this document or internet related link (collectively, Document) is of a general nature and is provided for information purposes only.. Although the information and opinions contained in this document are based on sources we believe to be reliable, to the extent permitted by law, ABC and its associated entities do not warrant, represent or guarantee, expressly or impliedly, that the information contained in this document is accurate, complete, reliable or current and accept no liability for any loss or damage relating to any use or reliance on the information in this document. The information is subject to change without notice and we are under no obligation to update it.