Sydney Property Is Sliding: Could Gold Be the Better Bet?
03 September 2026
Precious metals pulled back in the last week, with gold falling below the USD $4,500 per troy ounce (oz) price point and reversing the strong gains seen a week earlier.
At the time of writing, gold has pulled back 4.6%, trading at USD $4,387oz. Silver faced a slightly deeper decline, falling 5.6% to USD $65.4oz. The gold-to-silver-ratio (GSR) was unchanged at 67.
In local currency terms, both metals faced a marginally smaller fall, pulling back by 4.1% to AUD $6145.11oz and 5.0% to AUD $91.58oz respectively. The depreciation of the value of the Australian dollar against the US dollar (-0.6%) provided support to Australian investors.
Similarly, US and local equity markets faced marginal draw backs, with S&P 500, NASDAQ and ASX 200 falling 0.8%. 0.7% and 0.7% respectively. Contextually, this trend aligns with rises in US (4.7%) and Australian (2.3%) 10-Year treasury yields, with ongoing inflationary pressures fuelling concerns of rate hikes in both markets. Bitcoin also underperformed, falling 4% to USD $77,031.
The drawback of both precious metal and equity markets can be contributed to hawkish shifts in Federal Reserve expectations and escalations between the US and Iran. Fed chair Kevin Warsh’s tough line on inflation in his Jackson Hole speech last Friday raised market expectations of a rate hike in the next FED meeting by 36% (CME Group), a near-term headwind for precious metals.
The US-Iran conflict around the Strait of Hormuz has driven up Brent Crude significantly in the last week to above US $92/BLL (+8% week-on-week), pushing up energy prices and further fuelling inflationary pressures.
The Australian property market continues to experience an overall downturn following its peak in February of this year, with the national average declining 0.9% throughout August and 3.1% within the last quarter. Sydney has led the charge, with prices in the city declining 1.4% and 4.7% in August and in the last quarter respectively (Cotality).
These falls are spready unevenly across upper and lower end properties with properties priced above $1.9 million falling 1.8% during August (Cotality). Cheaper properties continue to be supported by the first home buyer scheme, facing a smaller decline across the same month of 0.6% (AFR).
Such inflationary pressures discussed above are being felt onshore here in Australia, evident through sticky inflationary data and the RBAs subsequent three consecutive rate hikes in February, March and May, bringing the target cash rate from 3.85% to 4.35% at present (RBA). This, combined with the Labor governments May budget announcements, have been the primary catalysts for the pullback and were explored more deeply in our previous article (ABC Bullion).
Three of the four Major banks (NAB, ANZ and CommBank) predict another 25bp cash rate hike as early as September, which would bring the target cash rate up to 4.6%. If this scenario were to play out, it will generate higher borrowing costs for investors and further dampen property demand, driving prices lower.
The Sydney Property Market
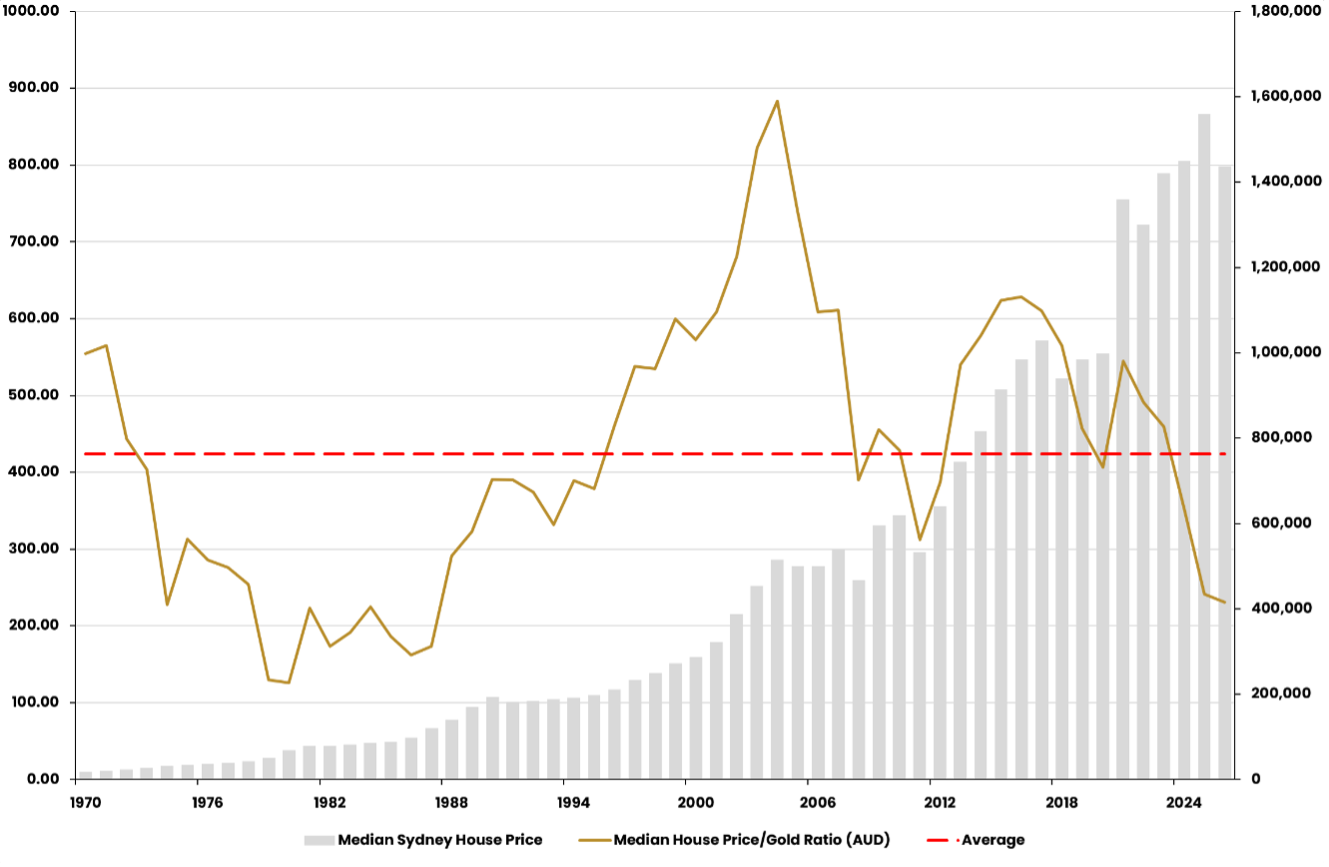
The gold line within the chart below illustrates the ratio of the median Sydney house price to the Australian dollar gold price since 1970, depicting the number of ounces of gold (in Australian dollar terms) required to purchase the median property value in Sydney each year. The chart also overlays the average of the ratio and the median Sydney house price in dollar terms, represented by the red dashed line and grey bars respectively.
Source: LBMA, ABS, Cotality, ABC Bullion
The long-term average of the ratio sits at approximately 423 ounces of gold. Periods where the ratio rises substantially above this level indicate that property is expensive relative to gold, and periods below the average suggest the opposite.
Several extreme periods stand out. During the early 2000s property boom, the ratio surged to a record high of approximately 883 ounces in 2004, meaning it required around 27.5kg of gold to purchase the median property in Sydney. Contextually, this period between 1990-2004 saw gold experience long years of post-recession stagnation as well as extreme decreases in demand during the tech-boom and RBA reserve sell off. This was paired with rising property prices, pushing the ratio up.
The peak in this ratio (883 ounces) was 54% higher than the peak of the national average (573 ounces) in 2004, previously discussed (ABC Bullion). Sydney was initially at the forefront of Australia’s early-2000s housing boom, driven by cheaper and more accessible credit, strong income and employment growth, investor speculation, favourable tax settings and Sydney-specific infrastructure and urban renewal around the 2000 Olympics.
On the other hand, the late 1970s and early 1980s show a sharp plunge to historical lows of 126 ounces (just under 4 kilos) as gold prices surged following the discontinuation of the gold standard by President Nixon in 1971.
This period was decorated with persistently high inflation, weak economic growth and sharp increases in interest rates (highs of 13% in Australia) reducing housing affordability nationwide and particularly in Sydney. This period coincided with the Hawke Labour Government’s removal of negative gearing for residential property int 1985, before it was reinstated two years later due to the collapse in the rental market.
During 2012-2016, the uptrend of the ratio aligns with the Australian property market heavily outperforming gold. A strengthening US economy, global equity bull runs and post 2011 commodities downturn contributed to the weak performance of gold. Conversely, an unprecedented East Coast real estate boom, low interest rates (1.5% August 2016) and an influx of foreign capital boosted up Australian housing markets, and in particular Sydney and Melbourne. Sydney property prices surged from a median of $640,000 in 2012 to $985,500 in 2016.
Property continued to boom from 2016 onwards, a period defined by structural shifts, structural undersupply of housing and intense affordability challenges. Low borrowing costs and strong population growth drove Sydney property prices up 10.3% in 2016 (ABS).
This trend is paralleled from the pandemic era and onwards (2020-now), where the property-to-gold ratio decreased despite property prices rising. Historically low cash rates (0.10%, 2020), record net overseas migration levels and federal schemes triggered a significant surge in housing demand and consequently drove property prices up post-COVID. However, global uncertainty, low interest rates and government relief stimulus also turned investors to gold as safe-haven asset. This led to gold outperforming the property surge, as visualised by the decreasing property to-gold ratio over this period.
As of end August 2026, the Sydney property-to-gold ratio sits at approximately 196 ounces (~6 kilos) with a median property price of $1,222,718 (Cotality).
Where next for Gold and Property?
HSBC is forecasting a peak to trough fall of 13% for national home prices, citing rising interest rates and recent tax changes by the Albanese government as key contributing factors (AFR).
Gold on the other hand has staged a strong recovery from its mid-July low of USD $3,972oz, rallying to a peak just below USD $4,700oz on 25 August. The move was supported by a combination of factors, including U.S. Treasury buybacks of longer-dated government bonds (10, 20 and 30-year maturities), which helped drive bond yields lower and weighed on the U.S. dollar. Improved investor sentiment, a technical rebound following the sharp correction earlier in the year and ongoing ETF inflows into the sector also provided meaningful support for precious metals prices.
While gold has since eased back from its recent highs, currently trading around USD $4,387oz (AUD $6,125oz), the pullback appears largely attributable to a renewed hawkish repricing of Federal Reserve rate expectations. Despite this near-term headwind, the broader outlook for gold remains constructive. Continued central bank accumulation, resilient investment demand, elevated global debt levels and ongoing geopolitical uncertainty continue to underpin the long-term investment case for the metal.
Until next time,

Jordan Eliseo
General Manager, ABC Bullion

Luke Tyler
Senior Analyst, ABC Bullion
Disclaimer: This document has been prepared by Australian Bullion Company (NSW) Pty Limited (ABN 82 002 858 602) (ABC). The information contained in this document or internet related link (collectively, Document) is of a general nature and is provided for information purposes only.. Although the information and opinions contained in this document are based on sources we believe to be reliable, to the extent permitted by law, ABC and its associated entities do not warrant, represent or guarantee, expressly or impliedly, that the information contained in this document is accurate, complete, reliable or current and accept no liability for any loss or damage relating to any use or reliance on the information in this document. The information is subject to change without notice and we are under no obligation to update it.